Software-as-a-Service applications have transformed how businesses provide technology, but this innovation brings some distinct monitoring complexities. When your end-users experience slowness but your dashboard shows all systems are sound, the disparity is typically due to monitoring blind spots inherent in SaaS configurations.
Traditional monitoring strategies, which have evolved to monitor applications assumed to be in a controlled data center, fail to provide insight into critical failure points in SaaS delivery paths. With a multi-tenant architecture, third-party dependencies, and Internet infrastructure components, today's applications require monitoring strategies that span the entire service delivery stack.
This guide outlines the top monitoring tools and techniques to ensure optimal SaaS performance in today's environments.
Summary of key features to look for in SaaS monitoring tools
SaaS monitoring requirements
SaaS applications introduce monitoring challenges that are not encountered in traditional setups. While traditional applications reside in managed data centers, SaaS applications are hosted on a distributed infrastructure with many possible failure points.
Cloud infrastructure challenges
Intrinsic differences produce some monitoring blind spots. Traditional monitoring tools cannot always keep up with the frequency of change that some code bases have. This can result in obsolete metrics or a monitoring setup that does not cover the system completely. A good setup will ensure that resource scaling occurs dynamically and calls for varying metrics compared to static ones. Configuration should also be done via infra as code.
Multi-tenancy increases the complexity. All or selected sets can be affected by performance problems. Operations teams need to be tenant-aware to distinguish between systemic and localized issues.
Architecture challenges
Modern distributed systems compound these problems. Microservices that span many regions create many places where issues remain invisible. A transaction that goes through dozens of services is impossible to trace without specialized tooling.
Dependency challenges
Third-party dependencies introduce a new level of complexity. SaaS applications must interact with various third-party services, such as payment processors, authentication, and storage services. If anything fails, it's critical, but it's hard to tell if the issue is with your code or a third-party dependency.
Network challenges
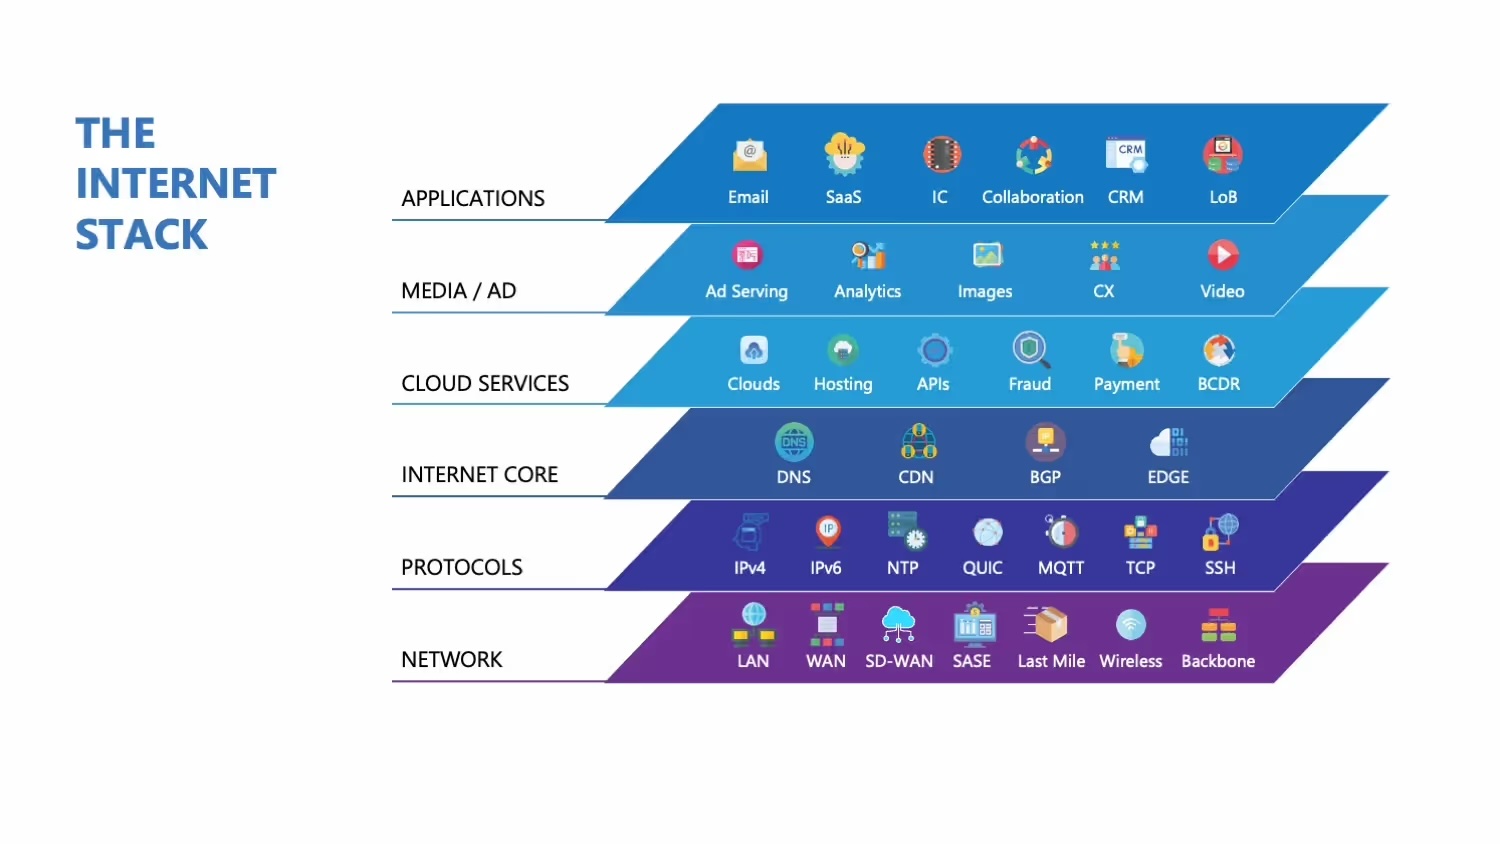
Most importantly, your Internet is part of your applications' infrastructure. This "Internet Stack" includes content delivery networks, DNS providers, backbone providers, and last-mile connectivity. A problem at any point in the delivery chain impacts users regardless of the internal health of your applications.
Main SaaS monitoring tool features to look for
Efficient SaaS monitoring requires insight into this entire stack. Teams need proactive notification, actual user experience metrics, API performance monitoring, insight into the infrastructure, and end-to-end Internet Stack monitoring.
Here are some features to consider when choosing a modern SaaS monitoring tool.
Synthetic monitoring
Synthetic monitoring involves software-run scripts that mimic user actions from various geographies. Rather than waiting to be notified of problems by customers, you can proactively test application performance and functionality.
Although synthetic monitoring is not subject to variations in browser settings or user patterns, unlike actual user traffic, it can produce robust baseline measures by running the same tests at set intervals from different geographic locations.
Synthetic monitoring is valuable in several essential situations.
- Tests business-critical activities such as logins and checkouts in real time.
- Provides you with objective SLA measurements that cannot be replicated using real user data.
- Assists with competitive benchmarking and ensures third-party integration.
Its most significant value is that it maintains visibility during the off-hours when real user traffic slows, but availability remains vital. Catchpoint offers a great guide on synthetic monitoring.
Real user monitoring
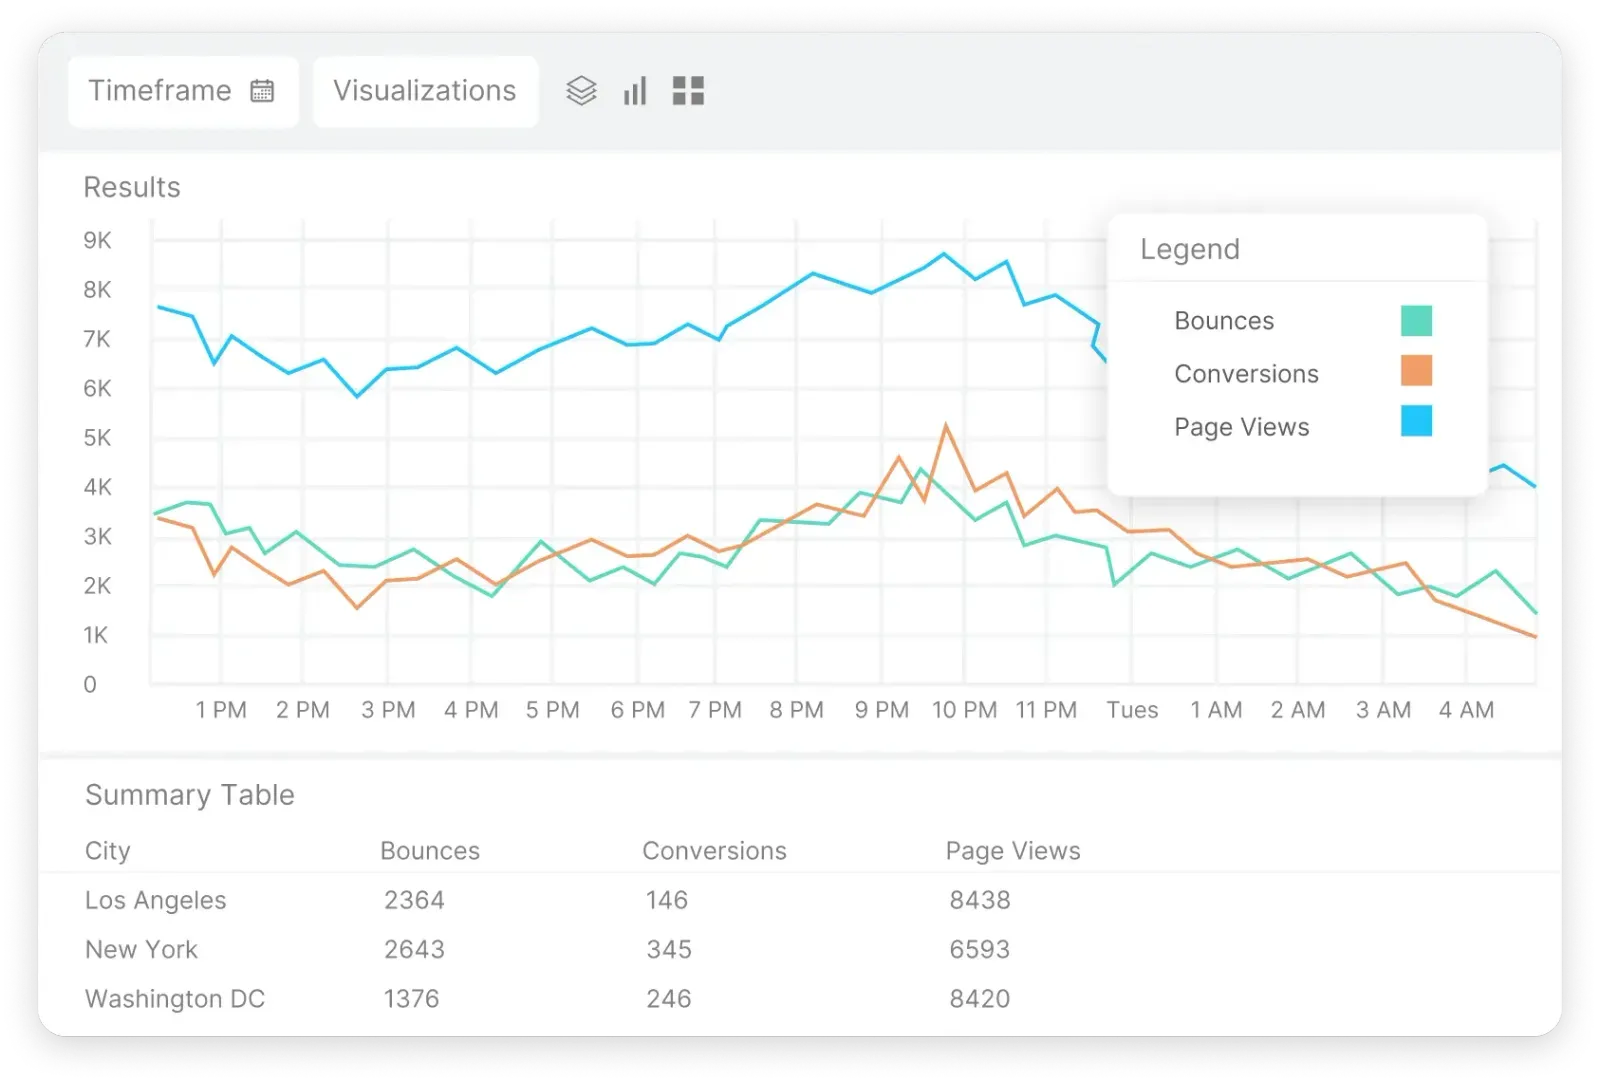
Your SaaS monitoring tool should provide both synthetic and real user monitoring features. While synthetic monitoring creates periodic baselines, real user monitoring (RUM) tracks actual user actions. A browser-based RUM collects actual user performance metrics from real users, measuring page load time, network requests, and front-end render timing.
Due to intermittent connectivity and varying device capabilities, mobile applications present specific monitoring challenges. Mobile RUM addresses them with lightweight SDK integration. It measures performance under different network conditions and monitors application-specific data, such as start-up time and screen transitions.
Catchpoint Mobile RUM with OpenTelemetry integration provides deep insight into mobile experiences, allowing teams to optimize performance in a world of device fragmentation. Session replay capability is also a part of full-featured RUM offerings, capturing user actions to reveal usability issues in visual recordings and interaction analytics.
API monitoring
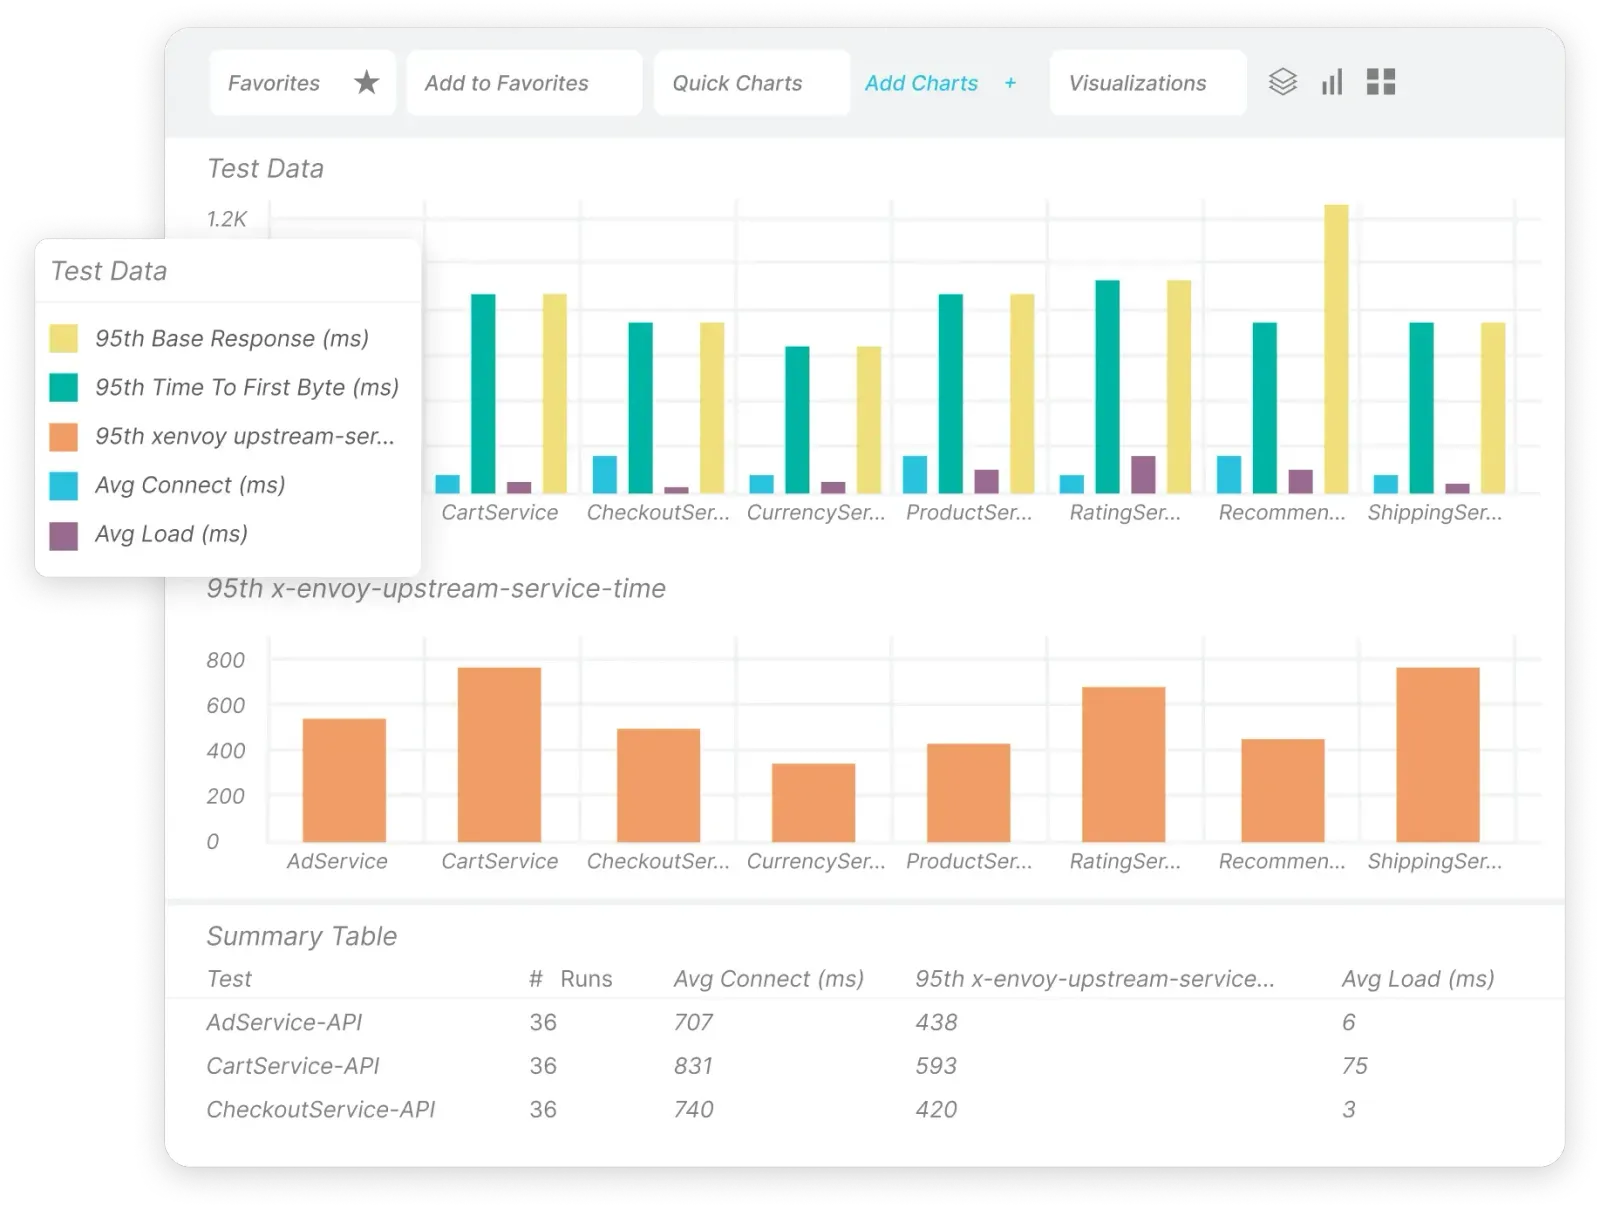
APIs are the lifeblood of SaaS applications today, and your SaaS monitoring tool should provide complete API monitoring. Beyond merely verifying that endpoints return correct status codes, proper monitoring must:
- Track response times from multiple locations
- Verify that the payload contents are accurate
- Identify performance trends across time and geography.
With microservice architecture, API monitoring is more complex. Teams want to see service dependencies and transaction flows. Distributed tracing helps trace requests as they span service boundaries and identify where latency occurs.
Knowing what "normal" is in your case is still useful. If your API should generally respond within 100ms, a spike to 300ms should be investigated, even if most of your monitoring systems still consider both acceptable.
Infrastructure monitoring
Although SaaS hides infrastructure from users, monitoring the underlying systems is still necessary. Cloud resource monitoring tracks compute, network, and storage metrics. Monitoring database performance includes slow-running queries, connection pool usage, and replication.
Full-stack observability
With increasingly more complex applications, integrated monitoring help has become increasingly beneficial. Full-stack observability platforms consolidate metrics, logs, and traces from all areas, enabling cross-domain correlation. This integration makes troubleshooting easier, fosters cross-team communication, and lowers mean time to resolve.
Dependency maps are vital to observability, as they provide a comprehensive view of the entire application delivery stack. Catchpoint’s Internet Stack Map provides a live view of your digital service and its health in the Internet Stack, allowing you to see how external factors, such as DNS providers and CDNs, influence application delivery.
Features in SaaS monitoring tools that enhance efficiency
Global testing network
Effective monitoring requires measurement from representative points of your user population. Worldwide monitoring with geographically dispersed agents and network types identifies localized issues that a centralized test would not.
BGP Monitoring
The internet relies on Border Gateway Protocol (BGP), which means that BGP performance can have a massive impact on a large scale. BGP, however, was not built with security in mind and is therefore vulnerable to deliberate attacks or unintentional misconfigurations. BGP monitoring helps ensure the network is always reachable and detects problems quickly to prevent BGP hijacking or any other malicious intent that would degrade user experience
Intelligent alerting
Alerting configurations should be well-balanced. Excessive alerts cause fatigue, but too few and you risk missing critical issues. Healthy alerting systems have well-defined severity levels, ownership mappings, troubleshooting context data, and thresholds based on actual effects rather than arbitrary limits.
Top alerts also have concise runbooks - easy-to-read guides on what to inspect first that help save precious repair time. Established escalation policies ensure vital issues are routed appropriately.
Integration with DevOps
Monitoring should be integrated seamlessly with development workflows. Monitoring configurations in code makes version control, peer review, and automatic deployment feasible. This approach creates a record of setups, facilitating change management, and new environments are made to inherit the correct monitoring automatically.
Real-time, Internet health insights
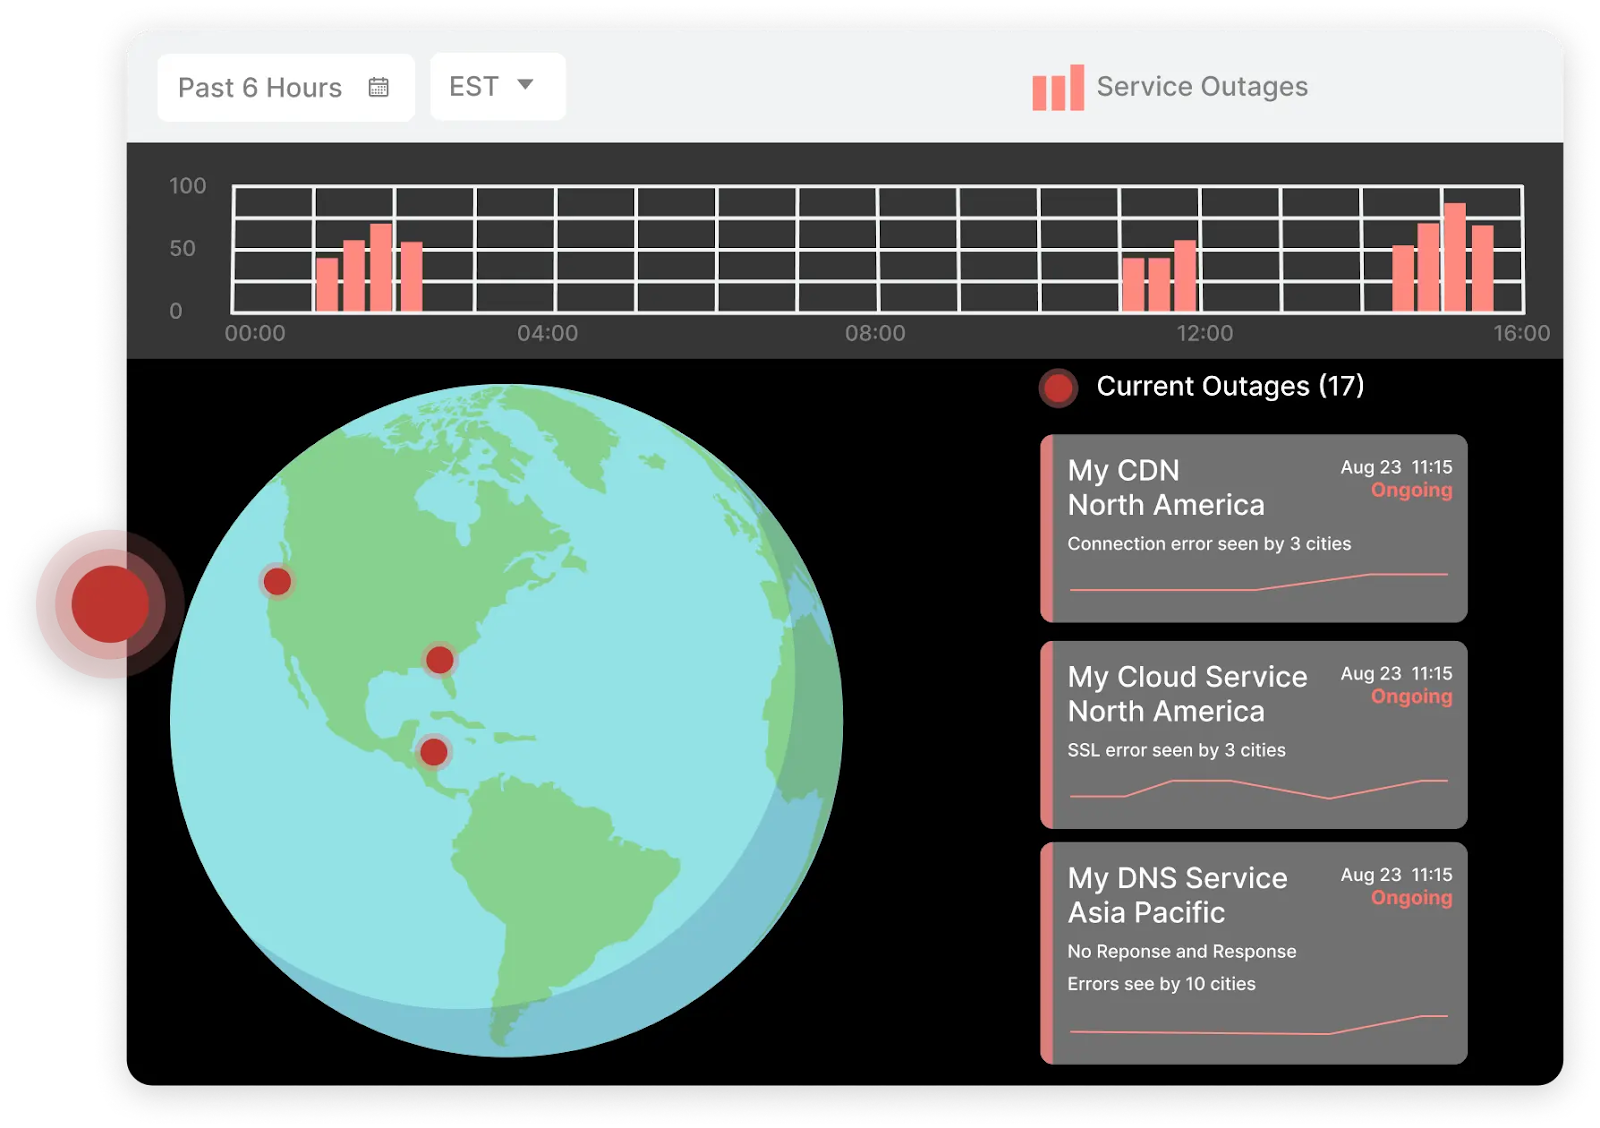
Using third-party software introduces risk: if it breaks, it can break you. That’s why gaining visibility into popular third-party dependencies is so invaluable. Catchpoint's Internet Sonar makes use of the world's largest and most active agent network to monitor the Internet's most popular services for outages. Using this information, teams can always identify the source of the problem and how long it's been going on, be sure it wasn't caused by them, and know whether or not it is likely to affect them.
Internet stack visibility
When users or monitoring tools report an "application problem" (like slowness, errors, unavailability), the root cause is frequently not the application's code or server, but rather an issue in the complex layers of the internet infrastructure that the application relies on to deliver its service. This highlights the importance of comprehensive, "end-to-end" monitoring. End-to-end monitoring requires measuring DNS resolution, CDNs, backbone networks, and last-mile connectivity.
Catchpoint's Internet Performance Monitoring approach offers this key level of insight. It enables teams to easily see each element and make its impact on overall performance visible. You can instantly identify whether the Internet infrastructure or application code causes problems.
Leading SaaS Monitoring Tools
The monitoring landscape is composed of diverse solutions that vary from full-fledged enterprise platforms to specialized tools for specific needs.
The enterprise solution provides integrated functionality within synthetic monitoring, real user monitoring, and infrastructural insight. Catchpoint stands out with unique characteristics: an unprecedented Global Agent Network with over 3000 intelligent agents, delivering deep visibility of the Internet Stack, integrated synthetic and RUM capabilities, and superior mobile app coverage.
Mid-market offerings strike a price and feature balance, and open-source alternatives provide technical teams with customization options. Niche tools offer targeted solutions to issues like front-end or API testing.
SaaS monitoring best practices
Start with your top-priority user flows. Identify workflows that directly affect business outcomes and include synthetic tests to validate those paths. Run tests from places representative of your users and at various moments of the day.
Implement alerts carefully according to real performance impact, not predefined limits. Take baseline performance measures before defining conditions to establish alerts, and revisit them periodically as your program evolves.
Integrate monitoring with CI/CD pipelines to ensure coverage before deployment. Monitor new features, set appropriate alerts, and maintain dashboards that show current metrics.
For mobile applications, adopt lightweight RUM SDKs to capture the distinctive mobile experience behaviors like network traversals, app start time, and battery consumption.
Monitoring ROI measurement
Several measurements are used to monitor the value:
- Mean time to detection
- Mean time to resolution
- Downtime reduction
- Performance improvement and support tickets received.
Calculate the cost of downtime by adding revenue loss, productivity impacts, cost to recover, and reimbursement to the customer.
Apart from preventing problems, monitoring allows ongoing optimization of resource usage, code efficiency, and third-party services. Such optimizations have hugely substantial cost-saving effects beyond preventing immediate downtime.
Conclusion
SaaS monitoring has evolved beyond simply checking availability. Complex modern applications require multi-level visibility reaching down to user experience, application, and underlying infrastructures. The internet stack deserves particular consideration since problems in DNS, CDN, or network routing can have a catastrophic impact on the user experience, even when application components perform flawlessly.
SaaS monitoring tools that provide this broader visibility help teams avoid frustrating performance mysteries by making the problem sources glaringly obvious. With the right monitoring strategy, teams have complete insight at all levels that influence user experience, shifting monitoring away from a technical necessity to a true business asset that directly enhances business and customer satisfaction.

